 How important and predictive is the first click on a website?
Some earlier research by Bob Bailey and Cari Wolfson, conducted between 2006 and 2009 across a dozen studies, found an interesting result. If a user’s first click on a website was down one of the optimal paths for the intended task, 87% of those users eventually succeeded.
If, however, that first click was not down the optimal path, only 46% of users succeeded. In other words, users were almost twice as likely to succeed if their first click was down the right path on the websites they tested. That was an interesting and powerful finding that we cover in our MeasuringUniversity courses. But because the only estimate of the first click effect we knew of was based on the Bailey and Wolfson studies, we wanted to replicate it.
In our first replication study (using five websites, 21 tasks, and 750 participants), we found a more modest result. On average, users were 13% more likely to succeed after making the correct/optimal first click (70% vs. 78%—8 percentage points = 13% relative increase, a ratio of 1.1). We found that it was challenging to identify the optimal first click for several tasks on live websites, which may have contributed to our less conclusive results. We then analyzed tree-testing data across 137 tasks and 1,000 participants and found a strong pattern. Participants whose first click was down the correct tree path were more than six times as likely to succeed if their first choice was correct (81% vs. 14%).
While the results were compelling for tree testing, where design elements and search features have been removed, we wanted to explore testing with an image.
Click testing is a popular method for assessing where participants will first click on an interface. It’s integrated into software like our MUIQ® platform, which makes it easy for designers or product owners to upload a screenshot of a product, website, or prototype (theirs or a competitor’s). But like the impact of think aloud (TA) testing on metrics or images on card sorting, little has been documented about the effects of click testing on images.
The Bailey and Wolfson study is often used as a rationale for why click testing is effective (i.e., fast to run and reasonably predictive of future task success on a live website). But Bailey and Wolfson didn’t use a click test to generate their findings. They analyzed the first click of participants as part of a task on functional websites to assess (1) if the first click was the start of a successful path and (2) if the final click successfully ended the task. This raises the question of the extent to which first clicks on an image correspond with first clicks on a live website.
Of course, tree tests, click testing, and prototypes act as surrogates for the final interface. And in some cases, we do have data that these surrogates act as reasonably good predictors for the final interface. For example, in our review of using prototypes in usability testing, we found that low-fidelity prototypes are reasonable, although imperfect, substitutes for high-fidelity prototypes or complete products. Low-fidelity prototypes are useful for identifying usability problems and can generate reliable estimates of subjective ease ratings, but they are less accurate for task times and aesthetic measures. This suggests that images can be seen as a form of prototype and may indeed be adequate representations of the website.
But although our analysis of tree testing found the first click was predictive of success, it was a success in a tree test, not on the final website. In 2013, we did some preliminary investigations to see how well tree testing predicted live site navigation, and for the two websites we tested, the results were mixed (something we’ll revisit in a future article).
To our knowledge, no one has attempted to validate click testing against live website effectiveness. Here’s what we want to find out:
- Are the first clicks on images the same as those on fully functional websites?
- Is the first click on a dynamic product page different than on a static homepage?
- Is the task success rate the same on a live website as it is on an image?
- Is the time to first click the same on images and websites?
- Are measures of task ease (e.g., the SEQ) comparable on image versus live sites?
- Is the first click a successful predictor of task success on live websites and images?
- Do people click below the “fold” more or less on a live site versus images?
- What are other similarities/differences between the navigation/use behavior using an image versus a live website?
- How do these same questions apply on mobile click tests?
In this article, we’ll cover the first research question—comparing image first clicks to live site first clicks.
Study Overview
In February 2023, we recruited participants from a US-based online panel to participate in an online study. Participants were randomly assigned to either a click test or a live site condition. We used a new, integrated click-testing feature of MUIQ that allows us to randomly assign participants to either a click test or a live study test. We can then isolate the effects of image versus live site to better understand the details of this popular method and even look into potential differences in dropout rates, similar to our findings in card sorting with images.
In both conditions, participants were asked to complete a short task on five websites (if assigned to the live site condition) or the same task on five high-resolution screenshot images (if assigned to the image condition).
We selected five websites and tasks that would make it relatively easy to compare clicks on both types of interfaces. We found from our earlier research on click testing that it can be hard to track clicks on hover menus or dynamic website elements like carousels. We also started with the homepage of websites.
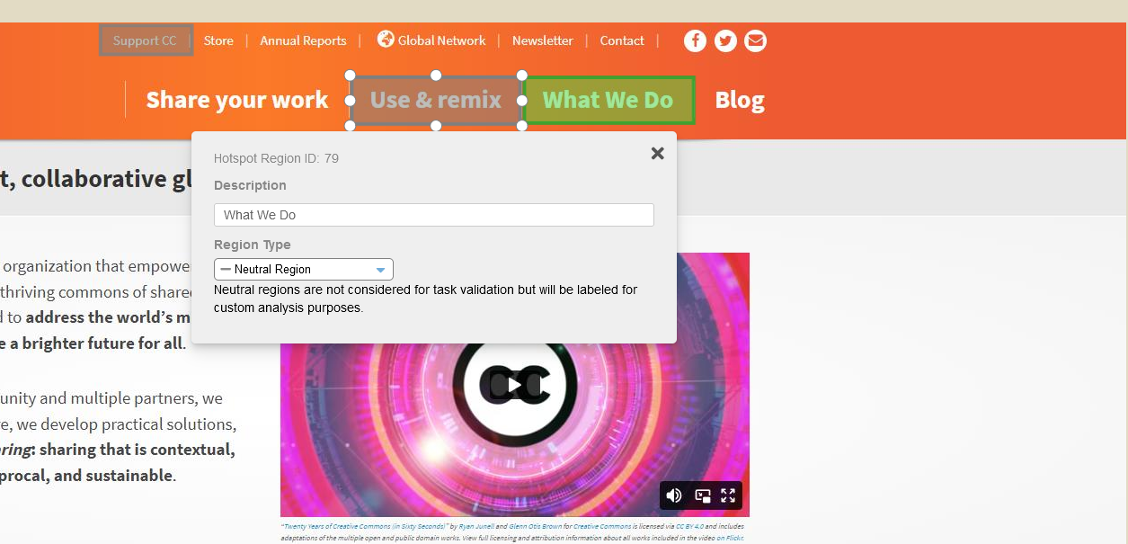
In the click-testing condition, participants were provided with the task instructions and shown a full-page image of the website. Regions of the image that we expected participants to click we coded as hotspots (Figure 1). Participants were given a task and told to click on the image as if they were on the actual website.
Tasks
Participants in both conditions were presented with the same five tasks in randomized order, shown below for each of the five websites/images.
Creative Commons: Imagine that you want to find information about what sort of Creative Commons license you need to share a video you made to the correct audience online. Where would you go to do that on the Creative Commons website?
NASA: Imagine that you want to learn more about how NASA was first formed. Where would you go to do that on the NASA website?
Disqus: Disqus is a blog comment hosting service for websites and online communities. Imagine that you want to find more details about the website add-ons that Disqus provides. Where would you go to do that on the Disqus website?
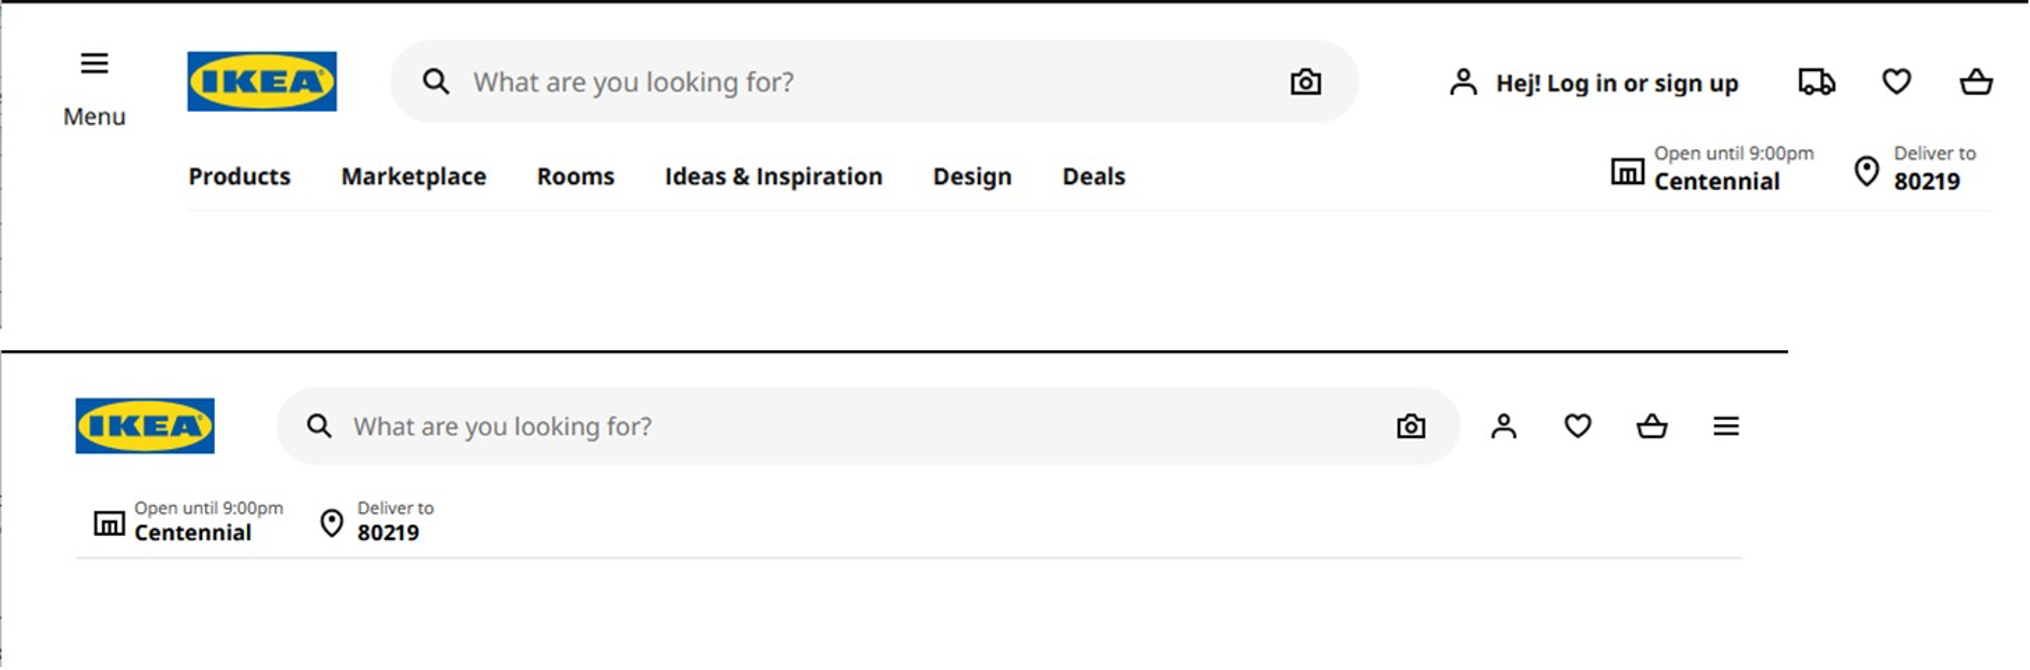
IKEA: Imagine that you have completed an order and want to know where your package is at. Where would you go to track your order from the IKEA website?
CA State: Imagine that you want to find information on state parks on the California state website. Where would you go to do this on the California state website?
Participants could click as many times as they wanted, but for this analysis, we focused on the first click. As shown in Video 1, click marks were left on the image but not on the live website.
Video 1: Short video of click test demonstrating red dot on one of the website images.
Study Results
We collected data from 130 participants split between the two conditions. The median study time was ten minutes and differed by condition, possibly influenced by the tendency of participants to click more often on the live site. Table 1 shows that it took participants longer to complete the live website study, and they were more than twice as likely to drop out compared to participants in the image condition.
| Condition | N | Median Time | Mean Clicks | Dropout |
|---|---|---|---|---|
| Live | 68 | 11.7 min | 3.1 | 8% |
| Image | 62 | 9 min | 1.7 | 3% |
Table 1: Median time and dropout rates for live and image conditions.
While the click-testing feature in MUIQ doesn’t require a browser extension or plugin, collecting clicks on live websites does. However, we had all participants in the study download the extension to keep the experiences as comparable as possible. That suggests that the difference in the dropout rate isn’t because of the extension but for other reasons, such as the length of the study or difficulty in completing some of the tasks.
Differences in Stimuli
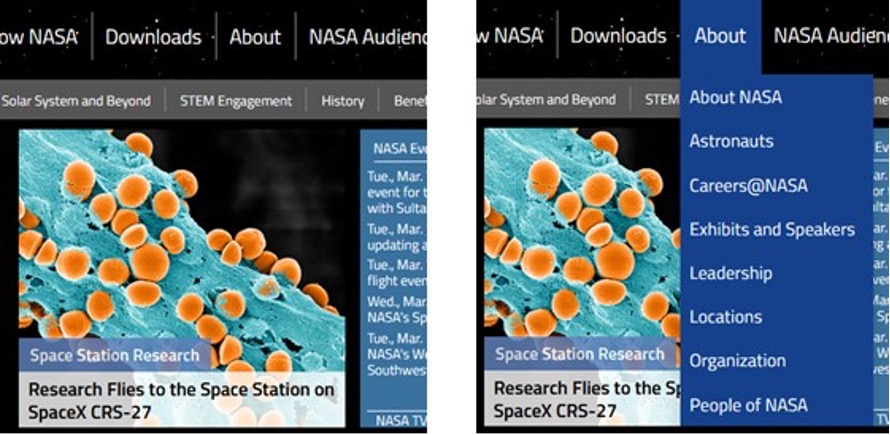
Despite our efforts to select relatively static websites that were comparable to static images, our first challenge in analyzing data came from some differences in dynamic elements on the live sites that weren’t visible on the static image. One of the more notable examples came on the NASA website. Participants were asked to find more information on how NASA was formed (see task description above).
One direct path to this information is a link to “History” that is visible on both the live site and the image. However, a significant portion of participants in the live site condition hovered or clicked on “About” on the top menu (Figure 2). This provides another path to information under “About NASA” but this path wasn’t available to click test participants who saw only the static image. What’s more, clicking “About” on the NASA.gov website does nothing but open the submenu (Figure 2).
We had to decide how to handle this click discrepancy because of the differences in what is presented to participants. On one hand, we could use a more “strict” scoring rubric and code clicking on About > About NASA as different than clicking on History (after all, they are different places).
On the other hand, we could use a more relaxed or “lax” coding scheme and consider these as comparable clicks given one condition couldn’t click on a hover menu. We decided to code both lax and strict coding schemes to see whether the conclusions would differ.
Coding Hotspots
We identified the same hotspot regions on both the image and live site conditions using both a lax and strict scheme. As shown in Table 2, 28 total hotspot regions were in the lax scheme (between 3 and 9 per website), and 33 hotspot regions were in the strict coding scheme (between 3 and 12). We then focused on the first click of each participant as our primary dependent variable.
| Lax | ||||
| Strict |
Table 2: Hotspots and the differences in first click percentages.
The hotspot regions accounted for an average of 87% of first clicks on the live websites and 89% of first clicks on the images for both lax and strict coding schemes. The other clicks were distributed across the websites or images respectively in other places (e.g., footers or links throughout the page).
Of the 28 hotspot regions for the lax coding scheme, 4 (14%) had statistically significant differences in first-click percentages (at p < .10 level). For the strict coding scheme, 7 out of 33 hotspots (21%) were significantly different. The average difference between the number of participants’ first clicks in a region was about the same for both coding schemes (5.1% lax and 7.0% strict), but the maximum difference was almost twice as high for the strict (40% strict vs. 23% lax). The 40% maximum difference came from the NASA website’s About menu (shown in Figure 2).
We overlayed the percent of first clicks from participants in the image versus the live site for selected lax hotspot regions in Figures 3 through 7.
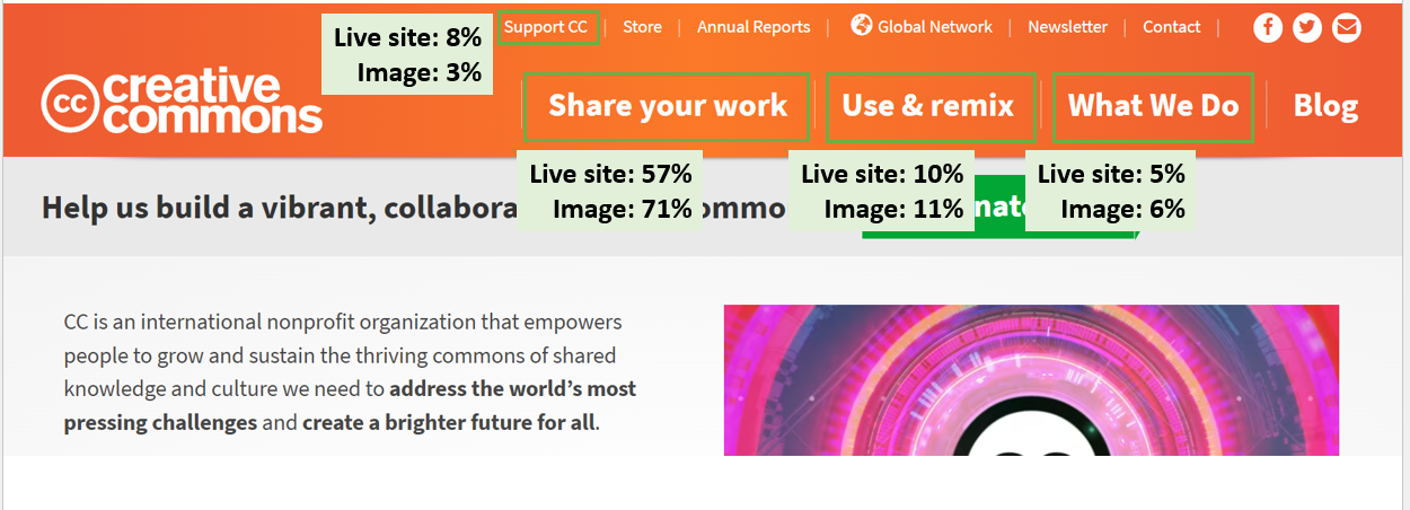
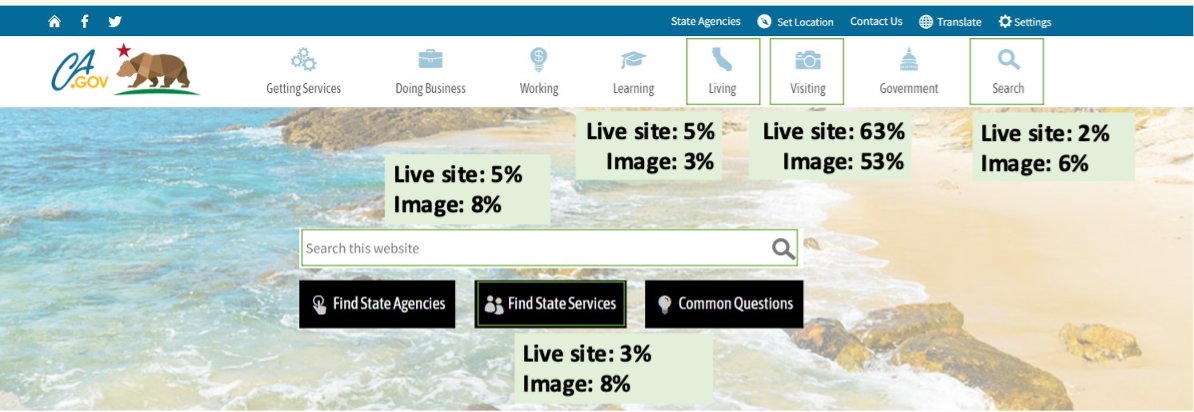
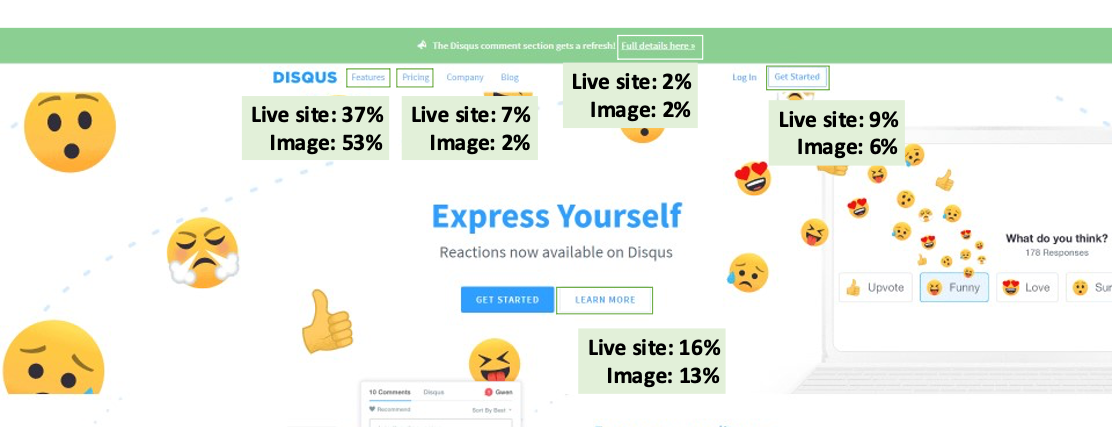


Table 3 shows the difference between the percentage of clicks for the 28 lax regions across the five websites. The largest difference was 23% on the IKEA website, followed by a 16% difference on the Disqus website.
| Website /Region | Live % | Image % | Abs % Diff |
|---|---|---|---|
| Creative | |||
| CC logo bottom page | 2% | 0% | 2% |
| Search bottom page | 2% | 0% | 2% |
| What we do (top bar) | 5% | 6% | 2% |
| Support-CC | 8% | 3% | 5% |
| Share Work (at top) | 57% | 71% | 14% |
| Link in "The Growing Commons" para | 2% | 0% | 2% |
| Use-Remix | 10% | 11% | 1% |
| Total | 85% | 92% | 7% |
| NASA | |||
| Hamburger on right, clicks About to view dropdown | 2% | 0% | 2% |
| *Mission | 0% | 6% | 6% |
| About | 47% | 34% | 13% |
| History | 48% | 53% | 5% |
| Total | 97% | 94% | 3% |
| Disqus | |||
| Full details here (top green banner) | 2% | 2% | 0% |
| Get started at bottom | 2% | 3% | 1% |
| Logo at bottom | 2% | 0% | 2% |
| *"Features" on top | 37% | 53% | 16% |
| Learn More" white button | 16% | 13% | 3% |
| Learn More" after Engage Your Audience paragraph | 5% | 5% | 0% |
| Bottom page "Features" | 4% | 5% | 1% |
| Pricing | 7% | 2% | 5% |
| Signup | 9% | 6% | 2% |
| Total | 82% | 89% | 6% |
| IKEA | |||
| *Hamburger | 19% | 8% | 11% |
| *Sign in button | 6% | 29% | 23% |
| Truck (Track-Manage Order) | 55% | 53% | 2% |
| Total | 81% | 90% | 10% |
| CA | |||
| Search bar | 5% | 8% | 3% |
| Search (top) | 2% | 6% | 5% |
| Living | 5% | 3% | 2% |
| Services button | 3% | 8% | 5% |
| Visiting | 63% | 53% | 10% |
| Total | 77% | 79% | 2% |
Table 3: Difference in the percentage of clicks (live site minus image) by selected regions across the five websites using the “lax” method of comparability (rounding errors restricted to ±1%). Four of the 28 regions had statistically significant differences (* highlight = p < .10).
Reasons for First Click Differences
We investigated the possible reasons for the discrepancies in participants’ first clicks between image and live site conditions in both the lax and strict comparisons.
Key Differences in Stimuli
By far the biggest reason for differences is that live sites often have UI elements that are not present in the image. We saw this in the NASA hover issue (Figure 2), and it’s the likely culprit in many of the significant differences.
For example, on the Disqus website, 16% more participants clicked on a “Features” element at the top of the page in the image condition. However, as shown in Video 2, participants in the live condition could simply hover over “Features” and then click a link from the hover menu.
Video 2: Video of a participant hovering over a menu on the Disqus website and clicking an element from within the hover menu.
In another example, the IKEA website navigation changed as the resolution lowered due to responsive design. A substantial 29% of participants in the image condition clicked on the sign-in link compared to 6% in the live site. Figure 8 shows the likely culprit is from the live websites with lower resolutions where the more prominent “Hej! Log in or sign up” element is reduced to just the person icon.
Also, on the IKEA website, 19% of participants clicked on the hamburger menu as their first choice, more than twice the 8% of participants in the image condition. We also suspect the changing display may have played a role (e.g., the shift in the position of the hamburger menu from the left in the image to the right on the reduced live site).
Other Differences
Other differences we observed are less easily explained.
NASA mission: It’s unclear why 6% of participants in the image condition clicked on “Missions” from the top menu (Figure 7) but no one on the live site did. We suspect the live site offered more alternatives that reduced the number of clicks but aren’t sure. Note that this relatively small difference of 6% (four clicks) is statistically significant because it is so close to zero, where variances are lowest, compared to percentages near 50%, where binomial variances are at their maximum.
Search used more on CA image: Somewhat surprising is that while the difference wasn’t statistically significant, twice as many people chose a search-first strategy on the CA image versus the live website (14% vs. 7%).
Summary and Discussion
Our analysis of first clicks by 130 participants randomly assigned to a live website or image and attempting the same tasks found that
First clicks are similar between images and live websites. Across hotspot regions, the average absolute difference in first-clicking behavior was only about 6% (strict 7% vs. lax 5.1%). Of the 28 regions, only 4 had statistically significant differences in the percent of first clicks when we used a lax coding scheme. Using the stricter coding resulted in 7 out of 33 regions being statistically different. The largest difference in first-click percentages between regions was 23% when we used a lax scoring scheme, but it was as high as 40% when we were stricter.
Differences in functionality drive different clicking. Despite our attempt to avoid differences in dynamic functionality like hover menus, participants still encountered them on some websites. The different stimuli drove different clicking behavior (especially on NASA, where one element had a substantial 40% difference in first clicks). We suspect that the accuracy of the early click-testing results reported by Bailey and Wolfson (data collected in 2006) might have benefited from conducting their research on government websites, which may have been slow to adopt the UI advances of Web 2.0 technologies such as hover menus, thus minimizing differences in click patterns between live sites and prototype wireframes. If you are conducting a first-click test on a site with hover menus or other dynamic elements, your results may not be comparable.
Unknown reasons for differences are topics for future research. For several statistical differences, we weren’t sure what was driving the different first-click behavior. These are different stimuli, and participants in the image condition were told it was an image of a website and not an actual website, so to some extent, it makes sense that there would be some differences. A future study can investigate possible reasons for differences in click behavior by probing participants on their reasons for clicking.
Resolutions differ. It’s common for websites to respond to different resolutions for mobile or tablet devices by modifying what’s displayed. Responsive design also affects desktop participants: some websites had elements shift locations when resolutions were smaller.
Within-subjects effects are possible. We used a within-subjects approach to increase the power to detect differences in clicks across multiple websites. A possible downside of this approach, as is the case with many within-subjects designs, is a learning effect. Participants had more time to get used to clicking on images (five total), and that may have influenced clicking behavior. However, because a separate group of participants experienced the five live websites in a within-subjects approach, our comparison between images and live websites was done between-subjects, minimizing the influence of learning effects. In a future analysis, we can run a fully between-subjects study.
Likely a best-case scenario: Because we attempted to find tasks that were relatively simple to complete on homepages and used website homepages with few dynamic elements, we suspect the comparability of ~6% between images and live websites is a best-case scenario. In future studies, we will continue to compare more dynamic website elements and tasks to see how well first clicks on images compare to live website interactions. It would also be good to understand how these findings may extend to mobile websites and apps, which often have more simplified interfaces with many navigation options packed into a hamburger menu.
We covered these results and more in our webinar on click testing. Presented on Wednesday, March 29, 2023, the recording of the webinar and access to the slides are available for purchase: Using Click Testing to Answer UX Research Questions.


